IV Dislocations: Identifying Mispriced Implied Volatility for Premium-Selling Opportunities
Implied Volatility (IV) dislocations offer significant opportunities for options traders to sell premium when market expectations of future volatility diverge from historical norms or cross-asset relationships. This report details identifying mispricings through IV Rank extremes, term structure inversions, and cross-asset divergences, providing actionable strategies for capitalizing on these inefficiencies with defined risk parameters.
Executive Summary
Implied Volatility (IV) dislocations represent significant opportunities for sophisticated options traders to sell premium when market expectations of future volatility diverge substantially from historical norms or cross-asset relationships. This report delves into identifying such mispricings through IV Rank extremes, term structure inversions, and cross-asset divergences, providing actionable strategies for capitalizing on these inefficiencies. By systematically exploiting the mean-reverting nature of volatility, traders can construct high-probability, premium-selling trades with defined risk parameters.
The Anomaly Explained
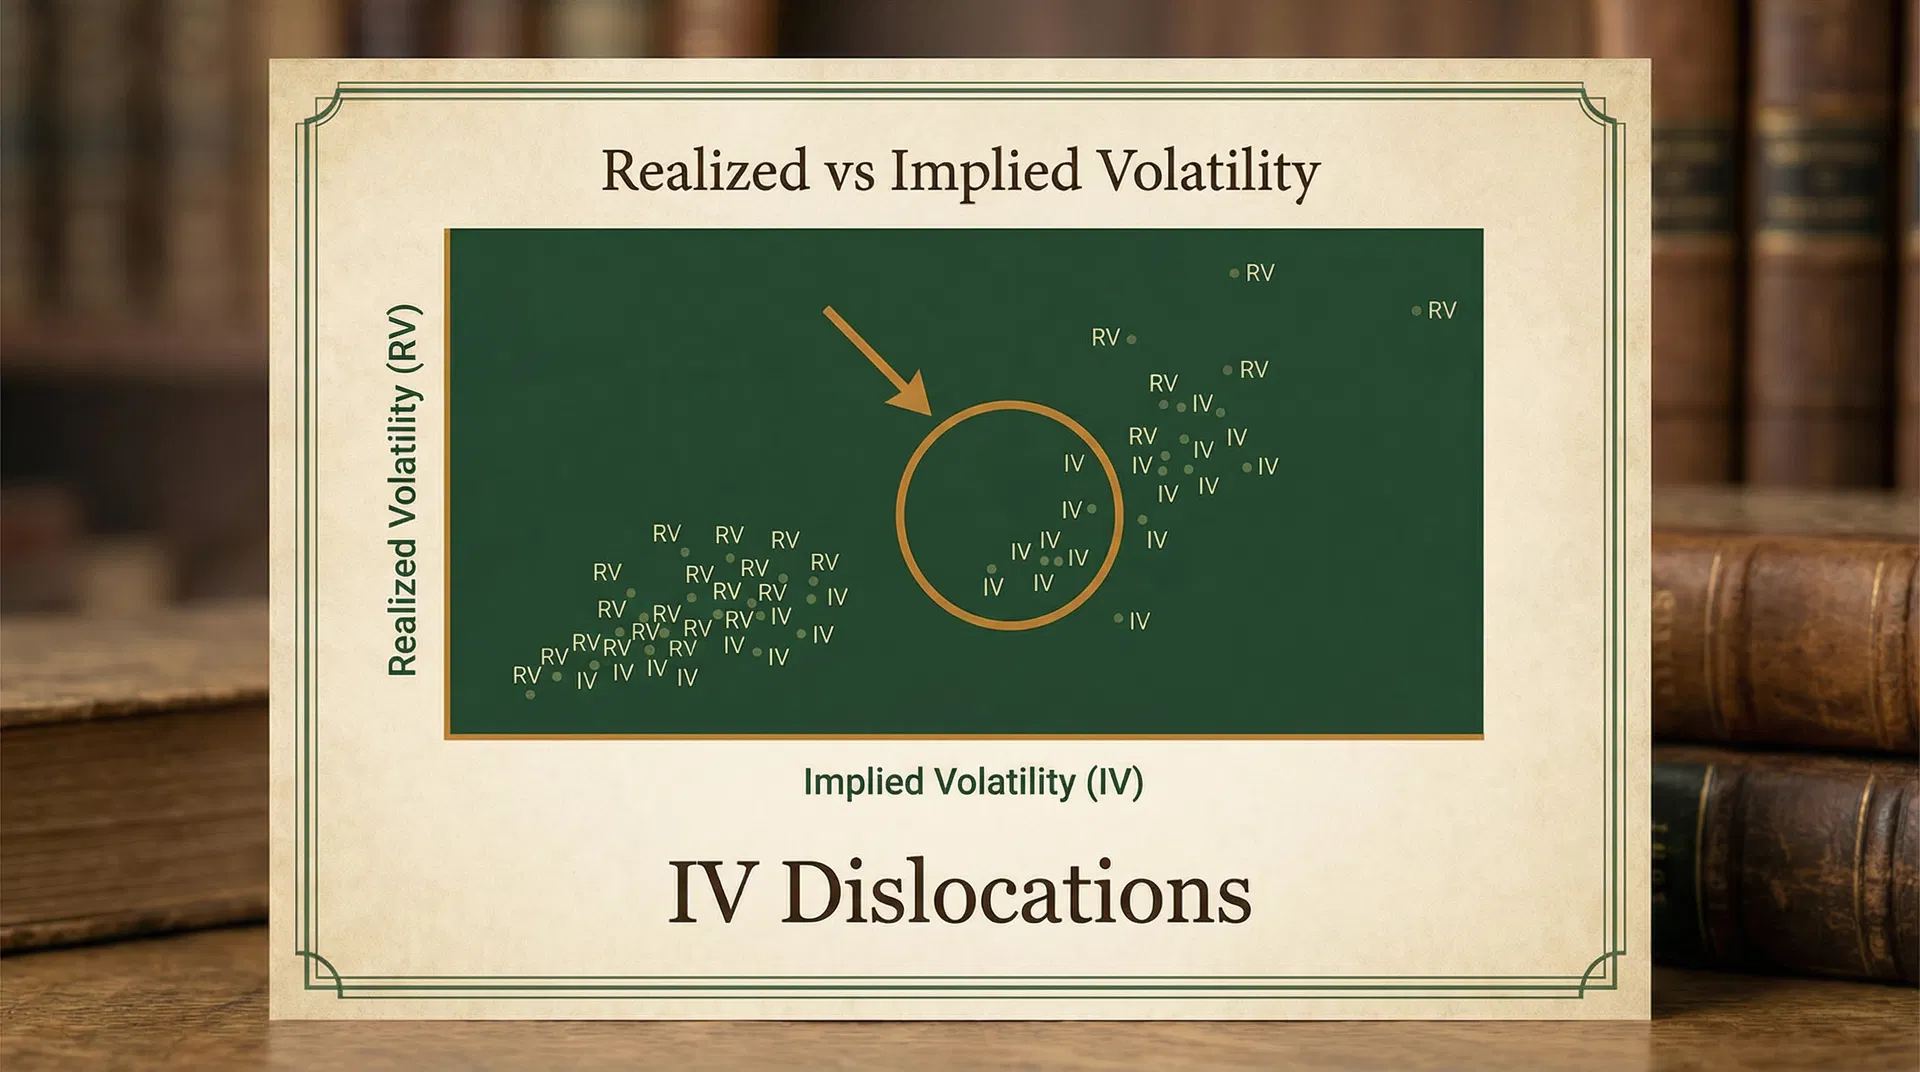
The core of volatility anomaly trading lies in the persistent observation that implied volatility (IV) often overestimates subsequent realized volatility (RV) [1]. This phenomenon, known as the volatility risk premium (VRP), suggests that options are, on average, priced higher than what actual price movements justify. Market participants, driven by hedging demands, behavioral biases, and information asymmetry, tend to bid up option prices, particularly during periods of uncertainty or fear, leading to elevated IV.
IV Dislocations occur when this overestimation becomes extreme or when the relationships between different volatility measures break down. These dislocations manifest in several forms:
-
IV Rank Extremes: Implied Volatility Rank (IVR) measures the current IV relative to its historical range over a specific period (e.g., the past year). A high IVR (e.g., above 70-80%) indicates that current IV is near its annual highs, suggesting options are relatively expensive. This often happens when investors overreact to recent events, leading to a temporary surge in IV that is likely to mean-revert [1]. Conversely, a low IVR suggests options are cheap.
-
Term Structure Inversions (Backwardation): The volatility term structure plots implied volatility against different expiration dates. Typically, it is in contango, meaning longer-dated options have higher IV than shorter-dated options, reflecting greater uncertainty over longer horizons. An inverted term structure, or backwardation, occurs when shorter-dated options have higher IV than longer-dated options [2]. This usually signals acute near-term market stress or anticipation of a significant event, leading to a rush for short-dated hedges and an inflated premium in the front month. This elevated short-term IV is often unsustainable and prone to mean-reversion once the immediate threat subsides or the event passes.
-
Cross-Asset IV Divergences: These occur when the implied volatility of a particular asset (e.g., a stock or commodity) deviates significantly from the IV of related assets or broader market volatility indices (e.g., VIX). For instance, if a sector-specific stock's IV spikes dramatically while the overall market IV remains subdued, it could indicate an isolated mispricing rather than a systemic shift. Such divergences can arise from idiosyncratic news, temporary supply/demand imbalances in the options market, or misinterpretation of information by market participants. Exploiting these divergences involves identifying the outlier and selling premium where IV is disproportionately high relative to its peers or historical correlation.
The market microstructure behind these anomalies involves the constant interplay of hedging activities, speculative positioning, and liquidity provision. Institutional investors often buy options for portfolio protection, creating a persistent demand that inflates IV. Market makers, who facilitate these transactions, manage their risk by adjusting their pricing models, often leaning on historical data and their own risk assessments. When a sudden influx of demand for protection or speculation occurs, especially in shorter-dated options, market makers widen spreads and increase IV to compensate for increased risk and order imbalances. This creates the temporary mispricings that premium sellers aim to exploit, betting on the eventual mean-reversion of volatility and the decay of extrinsic value.
Identifying the Setup
Volatility Cone
Current IV vs. historical realized vol percentile bands — identifies when IV is stretched
- 90th pct
- 75th pct
- Median
- 25th pct
- Median RV
- Current IV
Current IV (purple) above the 75th percentile band = elevated premium. Ideal entry zone for short volatility strategies.
Identifying actionable IV dislocations requires a systematic approach, combining quantitative screening with qualitative market analysis. The goal is to pinpoint situations where implied volatility is excessively high relative to its historical context, realized volatility, or peer assets, creating a favorable environment for premium selling.
1. IV Rank Extremes:
- IVR Threshold: A primary filter is a high Implied Volatility Rank (IVR). For premium selling, an IVR of 70% or higher is generally considered optimal [3]. This signifies that the current implied volatility is in the top 30% of its range over the past year, indicating options are relatively expensive. Some traders may consider a more conservative threshold of 80% or higher for conviction trades.
- IV Percentile (IVP): While IVR compares current IV to its 52-week high/low, IV Percentile (IVP) indicates the percentage of days in the past year where IV was lower than the current level. An IVP of 70% or higher suggests that 70% of the time in the last year, IV was lower than it is today, reinforcing the idea of elevated IV [4].
2. Term Structure Inversions:
- Detection: An inverted term structure (backwardation) is identified when the implied volatility of shorter-dated options (e.g., 30 DTE) is significantly higher than that of longer-dated options (e.g., 60 or 90 DTE) for the same underlying asset [2]. This can be visually observed by plotting the implied volatilities across different maturities. A steep downward slope from near-term to longer-term expirations is a clear signal.
- Context: These inversions are often triggered by specific, anticipated events (e.g., earnings, FDA announcements, geopolitical events) or periods of acute market fear. The opportunity arises when the market overprices the near-term event risk, creating an unsustainable spike in front-month IV that is likely to normalize post-event.
3. Cross-Asset IV Divergences:
- Relative Analysis: This involves comparing the IV of a target asset to its historical correlations with broader market indices (e.g., S&P 500, Nasdaq 100), sector-specific ETFs, or other highly correlated assets. A divergence occurs when the target asset's IV spikes while its correlated peers or the broader market remain relatively calm, or vice-versa.
- Quantitative Screening: Tools that track historical IV correlations and deviations can help identify these divergences. For example, if a tech stock's IV jumps by 20% while the QQQ (Nasdaq 100 ETF) IV remains flat, it suggests an idiosyncratic event driving the stock's IV, potentially creating a selling opportunity if the move is deemed an overreaction.
4. Trade Parameters for Premium Selling:
- Days to Expiration (DTE): For optimal theta decay and sufficient time for volatility mean-reversion, a DTE range of 30 to 60 days is generally preferred for selling premium [5]. This window balances rapid time decay with enough time for the trade to play out. Shorter DTE (e.g., 0-21 DTE) can offer faster decay but also carries higher gamma risk and less room for error.
- Delta Range: For selling out-of-the-money (OTM) options, a delta range of -0.10 to -0.30 for short puts and 0.10 to 0.30 for short calls is commonly used [6]. This corresponds to a probability of the option expiring in-the-money of approximately 10% to 30%, offering a balance between premium collected and probability of profit. For iron condors, the short strikes would typically fall within this range.
- Strike Selection: Strikes should be chosen to define a comfortable risk buffer, typically beyond one standard deviation move of the underlying, based on the implied volatility for the chosen expiration. This helps ensure a higher probability of profit and allows for potential adjustments.
References: [1] Goyal, A., & Saretto, A. (2009). Cross-section of Option Returns and Volatility. Journal of Financial Economics, 92(2), 205-221. [2] Romano RNR. (n.d.). Options trading part 8: Inverted term structure | Backwardation. Medium. Retrieved from https://romanornr.medium.com/options-trading-part-8-inverted-term-structure-backwardation-b739f729e536 [3] tastylive. (n.d.). Implied Volatility (IV) Rank & Percentile Explained. Retrieved from https://www.tastylive.com/concepts-strategies/implied-volatility-rank-percentile [4] Barchart.com. (n.d.). Implied Volatility IV Rank and IV Percentile. Retrieved from https://www.barchart.com/options/iv-rank-percentile [5] Predicting Alpha. (n.d.). Mastering Days to Expiration (Option DTE) in Options Trading. Retrieved from https://www.predictingalpha.com/option-dte/ [6] Investopedia. (n.d.). Position Delta in Options Trading: A Guide to Hedging Strategies. Retrieved from https://www.investopedia.com/articles/optioninvestor/03/021403.asp
Trade Construction
When implied volatility is dislocated and presents a premium-selling opportunity, an Iron Condor is a highly effective strategy due to its defined risk, limited profit potential, and ability to capitalize on both decreasing volatility and time decay. This strategy involves selling an out-of-the-money (OTM) call spread and an OTM put spread, creating a range within which the underlying asset can trade profitably.
Example: Hypothetical Iron Condor on SPY
Consider a scenario where the SPY (S&P 500 ETF) has an elevated IV Rank of 85%, indicating that options are historically expensive. The volatility term structure is in slight backwardation for the front month, suggesting near-term uncertainty is priced in, but expected to subside. We aim to capitalize on the mean-reversion of IV and time decay.
- Underlying Asset: SPY (Current Price: $450.00)
- Expiration: 45 Days to Expiration (DTE)
- Strategy: Iron Condor
Put Spread (Credit Put Spread): * Sell Put Strike: $430 (Delta approx. -0.15) * Buy Put Strike: $425 (Delta approx. -0.10) * Credit Received for Put Spread: $0.75
Call Spread (Credit Call Spread): * Sell Call Strike: $470 (Delta approx. 0.15) * Buy Call Strike: $475 (Delta approx. 0.10) * Credit Received for Call Spread: $0.70
Total Credit Received (Max Profit): $0.75 + $0.70 = $1.45 per share, or $145 per contract.
Max Loss: The difference between the strikes in either spread minus the total credit received. In this case, $5.00 (e.g., $430 - $425) - $1.45 = $3.55 per share, or $355 per contract. This occurs if the underlying closes below the long put strike or above the long call strike at expiration.
Breakeven Points: * Lower Breakeven: Short Put Strike - Total Credit = $430.00 - $1.45 = $428.55 * Upper Breakeven: Short Call Strike + Total Credit = $470.00 + $1.45 = $471.45
Probability of Profit (POP): Based on the deltas of the short strikes, the approximate probability of profit for this iron condor is calculated as 1 - (Delta of Short Put + Delta of Short Call) = 1 - (0.15 + 0.15) = 1 - 0.30 = 70%. This is a simplified estimation and actual POP can be derived from the option pricing model.
Risk/Reward Ratio: Max Profit / Max Loss = $145 / $355 ≈ 0.41:1. While the risk/reward ratio might seem unfavorable at first glance, the high probability of profit in a high IV environment often compensates for this, especially when combined with active trade management.
This iron condor is designed to profit if SPY remains between $428.55 and $471.45 at expiration. The wide range provides a buffer against minor price fluctuations, and the elevated IV ensures a substantial premium is collected upfront.
Entry/Exit Rules
Precise entry and exit rules are paramount for consistently profitable premium selling strategies, especially when exploiting IV dislocations. These rules minimize emotional decision-making and ensure disciplined trade management.
Entry Conditions: * IV Rank: The primary entry trigger is an IV Rank of 70% or higher for the underlying asset. This ensures that options are relatively expensive, maximizing the premium collected. * Term Structure: For strategies capitalizing on term structure inversions, ensure that shorter-dated options (e.g., 30 DTE) have significantly higher implied volatility than longer-dated options (e.g., 60+ DTE). * Cross-Asset Confirmation: If trading a cross-asset divergence, confirm that the target asset's IV is disproportionately high compared to its historical correlations with broader market indices or sector peers. * Technical Confirmation: While not strictly necessary for volatility-based trades, a neutral to slightly bullish/bearish technical outlook (depending on the specific spread) can provide additional conviction. Avoid entering trades against strong, sustained directional momentum unless specifically designed for such scenarios. * DTE: Target options with 30-60 Days to Expiration (DTE) to balance rapid theta decay with sufficient time for volatility mean-reversion. * Delta: Select short strikes with a delta between -0.10 and -0.30 for puts and 0.10 and 0.30 for calls, aiming for a high probability of profit.
Profit Taking: * 50% of Max Profit: The most common and highly effective profit-taking rule for premium selling strategies is to close the trade when 50% of the maximum potential profit has been realized. This strategy, popularized by research from firms like tasty*live*, aims to capture the fastest period of theta decay while avoiding the diminishing returns and increased gamma risk associated with holding trades closer to expiration. For the SPY Iron Condor example, this would mean closing the trade when the initial credit of $1.45 has decayed by $0.725, leaving $0.725 in remaining premium.
Stop Loss / Risk Management: * 1x Max Loss: A critical stop-loss rule is to exit the trade if the unrealized loss reaches 1x the maximum potential profit. For the SPY Iron Condor example, if the initial credit was $1.45, the stop loss would be triggered if the unrealized loss reached $1.45 (i.e., the option value increased by $1.45 from the initial credit collected). This effectively caps losses at a manageable level and prevents small losses from escalating into catastrophic ones. This rule is often applied on a closing basis to avoid whipsaws from intraday volatility. * Breakeven Breach: If the underlying price breaches either the upper or lower breakeven point and continues to move unfavorably, consider closing the trade or making adjustments. This is a more aggressive stop-loss than the 1x Max Profit rule but can prevent larger losses if the market moves sharply against the position.
Rolling Adjustments: * When to Roll: Rolling adjustments are employed when a trade moves against the position but has not yet hit the stop-loss, or when there is still significant time to expiration. The goal of rolling is to extend the trade duration, collect additional premium, and/or adjust strike prices to improve the probability of profit. * Roll Out: If a short strike is threatened (e.g., the underlying approaches the short put or call), roll the entire spread (or just the threatened side) to a later expiration date. This typically involves buying back the existing spread and selling a new spread further out in time, ideally collecting additional credit. * Roll Down (Puts) / Roll Up (Calls): If the underlying moves significantly against one side of the condor (e.g., drops towards the short put), consider rolling the call spread down to collect more credit and widen the profit tent, or rolling the put spread down to a lower strike to give the underlying more room. This must be done carefully to avoid creating an unbalanced risk profile. * Avoid Over-Adjusting: While adjustments can be beneficial, excessive rolling can lead to increased transaction costs and a skewed risk profile. Only roll when there is a clear strategic advantage and sufficient premium to be collected.
Risk Management
Effective risk management is paramount for the long-term success of any premium-selling strategy, particularly when exploiting IV dislocations. While these strategies offer a high probability of profit, they also carry the potential for significant losses if not managed diligently. The goal is to protect capital, minimize drawdowns, and ensure the longevity of the trading account.
1. Position Sizing:
Position sizing is arguably the most critical aspect of risk management. It dictates the amount of capital allocated to each trade and directly impacts the potential loss on any single position. A common guideline for options premium selling is to risk no more than 1-3% of total trading capital on any single trade [7]. This means that the maximum potential loss (e.g., for an iron condor, the width of the wings minus the credit received) should not exceed this percentage. For example, if a trading account has $100,000, the maximum loss on a single trade should be capped at $1,000 to $3,000. This conservative approach ensures that no single losing trade can severely impair the trading account.
2. Correlation Risk:
Correlation risk arises when multiple positions in a portfolio are highly correlated, meaning they tend to move in the same direction. If all positions are in assets that move together, a single adverse market event can negatively impact the entire portfolio simultaneously. To mitigate correlation risk: * Diversify Across Underlyings: Avoid concentrating positions in a single stock or sector. Spread trades across different industries, market capitalizations, and even asset classes (e.g., equities, commodities, currencies) to reduce idiosyncratic risk. * Monitor Portfolio Delta: While individual trades are delta-neutral or slightly directional, the overall portfolio delta should be closely monitored. A large net delta can expose the portfolio to significant directional risk, especially during sharp market moves. * Consider Macro Factors: Be aware of broader market themes and macroeconomic events that could impact multiple positions. For instance, a sudden interest rate hike could affect growth stocks differently than value stocks.
3. Tail Risk Scenarios:
Tail risk refers to the possibility of extreme, low-probability events that can have a severe impact on a portfolio. For premium sellers, these often involve rapid, significant moves in the underlying asset that blow past short strikes. While IV dislocations often imply a mean-reversion of volatility, a black swan event can lead to a sustained spike in volatility and price movement against the position. Strategies to manage tail risk include: * Defined Risk Strategies: Always employ defined-risk strategies like iron condors, credit spreads, or defined-risk butterflies. Naked options selling exposes traders to unlimited risk, which is generally not advisable. * Stop-Loss Orders: Implement strict stop-loss rules as outlined in the Entry/Exit section. Adhering to these rules is crucial to prevent small losses from escalating. * Portfolio Hedging: Consider using broader market hedges, such as buying OTM puts on an index ETF (e.g., SPY, QQQ) or VIX calls, to protect against systemic market downturns. These hedges can offset losses in individual positions during extreme market stress. * Cash Allocation: Maintain a significant portion of the portfolio in cash or highly liquid assets. This provides flexibility to absorb losses, adjust positions, or capitalize on new opportunities during volatile periods.
4. What Can Go Wrong:
Despite a high probability of profit, several factors can lead to losses in premium-selling strategies: * Sudden, Violent Price Moves: A rapid, unexpected move in the underlying asset that breaches both short and long strikes can lead to maximum loss. This is particularly true for earnings announcements or unforeseen news events. * Sustained Volatility Spike: While the strategy profits from mean-reversion of IV, a prolonged period of elevated volatility, especially if accompanied by significant directional movement, can keep options expensive and prevent profitable exits. * Liquidity Issues: In thinly traded options or during extreme market conditions, it may be difficult to exit positions at favorable prices, leading to wider bid-ask spreads and increased transaction costs. * Over-Leverage: Using excessive leverage can amplify both gains and losses, making the portfolio highly susceptible to adverse market movements. This often stems from poor position sizing. * Emotional Trading: Deviating from predefined entry/exit rules due to fear or greed is a common pitfall. Discipline is key to navigating the inherent risks.
By meticulously implementing these risk management principles, options traders can enhance the robustness of their premium-selling strategies and navigate the complexities of IV dislocations with greater confidence.
References: [7] Optionalpha. (n.d.). What to Know About Proper Position Sizing when Trading. Retrieved from https://optionalpha.com/blog/position-sizing-what-everybody-ought-to-know
Historical Context / Backtesting Evidence
The efficacy of selling premium in high implied volatility environments, particularly when IV is dislocated, is well-supported by academic research and empirical backtesting. The underlying principle is the persistent existence of the volatility risk premium (VRP), where implied volatility consistently overestimates future realized volatility. Options sellers profit from this structural inefficiency.
Numerous studies and backtests conducted by quantitative trading firms and independent researchers have consistently demonstrated that systematically selling options when IV Rank is high tends to yield positive expected returns over the long run. While specific figures can vary significantly based on the underlying asset, strategy type, DTE, delta selection, and risk management rules, general observations include:
- Win Rates: Strategies focused on selling out-of-the-money options (e.g., iron condors, credit spreads) in high IV environments typically exhibit high win rates, often ranging from 60% to 80% or even higher, depending on the delta chosen for the short strikes. This high probability of profit is a direct consequence of the VRP and the statistical edge derived from selling expensive options.
- Average Returns: While individual trade returns might be modest, the cumulative effect of consistent premium collection can lead to attractive average monthly or annual returns. Backtests often show annualized returns in the 15% to 30% range for well-managed portfolios employing these strategies, often outperforming buy-and-hold equity benchmarks on a risk-adjusted basis.
- Sharpe Ratios: A key measure of risk-adjusted return, Sharpe ratios for premium-selling strategies in high IV environments are generally favorable. While precise figures are highly dependent on portfolio construction and risk management, strategies that effectively harvest the VRP tend to demonstrate Sharpe ratios that are competitive with, or superior to, traditional asset classes, indicating efficient use of capital relative to the risk taken.
Evidence from IV Rank Strategies:
Backtests focusing specifically on IV Rank as an entry signal have shown its utility. For instance, studies often reveal that selling options when IV Rank is above 50% or 70% significantly improves the probability of profit and average trade profitability compared to selling options indiscriminately. The mean-reverting nature of IV means that elevated IV tends to fall back towards its historical average, benefiting options sellers through vega decay.
Evidence from Term Structure Inversions:
While less extensively documented in broad retail-focused backtests, academic research and institutional trading desks confirm that exploiting term structure inversions can be highly profitable. During backwardation, the front-month options are disproportionately expensive due. Selling these inflated short-dated options, particularly when the underlying event passes without the feared extreme move, allows traders to capture a substantial premium as the term structure normalizes. The profit comes from the rapid decay of the front-month IV and theta.
Evidence from Cross-Asset IV Divergences:
Exploiting cross-asset IV divergences is a more nuanced strategy, often employed by sophisticated quantitative funds. The premise is that market inefficiencies can lead to mispricing between correlated assets. By identifying an asset whose IV is an outlier relative to its peers or a broader market index, traders can construct relative value trades. For example, if a tech stock's IV jumps by 20% while the QQQ (Nasdaq 100 ETF) IV remains flat, it suggests an idiosyncratic event driving the stock's IV, potentially creating a selling opportunity if the move is deemed an overreaction. Backtesting such strategies typically involves complex statistical arbitrage models and has shown consistent, albeit often smaller, profits with lower correlation to broader market movements.
It is crucial to note that past performance is not indicative of future results. However, the persistent nature of the volatility risk premium and the behavioral biases that lead to IV dislocations provide a strong theoretical and empirical foundation for these strategies. Successful implementation relies heavily on disciplined execution, robust risk management, and continuous monitoring of market conditions.
ASCII/Text Diagram
Iron Condor Payoff Diagram
Iron Condor Payoff at Expiration
Short 50/45 put spread + Short 55/60 call spread | Net credit: $2.5
Max profit: $2.5/contract in the profit zone between $50–$55. Max loss: $2.50/contract outside the wings.
Profit
^
|
|      /\        /\
|     /  \      /  \
|    /    \    /    \
|   /      \  /      \
|  /        \/        \
+-------------------------------------> Price
   BP   SP          SC   BC

BP = Buy Put Strike
SP = Sell Put Strike
SC = Sell Call Strike
BC = Buy Call Strike
Volatility Term Structure: Contango vs. Backwardation
IV Term Structure
Implied Volatility vs. Realized Volatility across expiration dates
- Implied Vol (IV)
- Realized Vol (RV)
Normal contango: IV premium over RV creates consistent selling opportunities in near-term options.
Implied Volatility
^
|
|  Contango:  /\
|            /  \
|           /    \
|          /      \
|         /        \
|        /          \
| Backwardation: \   /
|                 \ /
|                  V
+-------------------------------------> Time to Expiration
Real Trade Example
To illustrate the practical application of identifying and trading IV dislocations, let's walk through a hypothetical Iron Condor trade on SPY, building upon the example outlined in the "Trade Construction" section.
Scenario:
On January 15, 2026, SPY is trading at $450.00. Market conditions indicate an elevated IV Rank of 85% and a slight backwardation in the front-month term structure, signaling a premium-selling opportunity. We decide to implement the Iron Condor strategy.
Entry (January 15, 2026):
- Underlying: SPY @ $450.00
- Expiration: February 28, 2026 (45 DTE)
- Strategy: Iron Condor (1 contract)
- Sell 1 SPY Feb 28 $430 Put @ $1.50 (Delta -0.15)
- Buy 1 SPY Feb 28 $425 Put @ $0.75 (Delta -0.10)
- Sell 1 SPY Feb 28 $470 Call @ $1.40 (Delta 0.15)
- Buy 1 SPY Feb 28 $475 Call @ $0.70 (Delta 0.10)
- Total Credit Received: ($1.50 - $0.75) + ($1.40 - $0.70) = $0.75 + $0.70 = $1.45 per share, or $145.00 for one contract.
- Max Profit: $145.00
- Max Loss: $500.00 (width of spread) - $145.00 (credit) = $355.00
- Breakevens: Lower: $430 - $1.45 = $428.55; Upper: $470 + $1.45 = $471.45
Trade Progression:
Over the next few weeks, SPY trades within our defined range, fluctuating between $445 and $460. Implied volatility, as anticipated, begins to mean-revert from its elevated levels, contributing to the decay of the option premiums. Theta decay also works in our favor, eroding the extrinsic value of the options.
Adjustment (February 10, 2026):
SPY has drifted lower to $440.00, and the short put strike of $430 is now closer to the money. The put spread is showing a small unrealized loss, while the call spread is showing a larger unrealized gain. To manage risk and collect additional premium, we decide to roll the call spread down.
- Buy to Close 1 SPY Feb 28 $470/$475 Call Spread @ $0.30 (initial credit $0.70, so $0.40 profit on call side)
- Sell to Open 1 SPY Feb 28 $460/$465 Call Spread @ $0.80 (Delta 0.18 for short call)
- Net Credit from Adjustment: $0.80 - $0.30 = $0.50
- New Total Credit Received: $1.45 (initial) + $0.50 (adjustment) = $1.95
This adjustment moves our upper breakeven closer to the current price but significantly increases the total credit received, providing a larger buffer against potential losses and increasing the maximum profit potential. The new short call delta is still within an acceptable range.
Exit (February 20, 2026):
With 8 DTE remaining, SPY is trading at $448.00. The total value of the Iron Condor has decayed significantly, and we have realized approximately 55% of our maximum potential profit. Following our profit-taking rule, we decide to close the entire position.
- Buy to Close 1 SPY Feb 28 $430/$425 Put Spread @ $0.20
- Buy to Close 1 SPY Feb 28 $460/$465 Call Spread @ $0.15
- Total Debit to Close: $0.20 + $0.15 = $0.35
Profit and Loss Calculation:
- Total Credit Collected: $1.95 (initial $1.45 + adjustment $0.50)
- Total Debit Paid to Close: $0.35
- Net Profit: $1.95 - $0.35 = $1.60 per share, or $160.00 for one contract.
In this example, by identifying an IV dislocation, constructing a defined-risk trade, making a timely adjustment, and adhering to profit-taking rules, the trade generated a profit of $160.00. This demonstrates how active management and disciplined execution can capitalize on the mean-reverting nature of implied volatility.
Key Takeaways
- Volatility Mean Reversion is Key: Implied volatility, especially when extreme, tends to revert to its historical average. Premium selling strategies capitalize on this fundamental principle.
- IV Rank is Your Edge: Prioritize trades where the underlying asset has a high IV Rank (70%+), indicating options are historically expensive and offer greater premium for selling.
- Term Structure Inversions Signal Opportunity: Backwardation in the volatility term structure (shorter-dated IV > longer-dated IV) often signals temporary, elevated near-term risk pricing that can be exploited by selling front-month premium.
- Defined Risk and Position Sizing are Non-Negotiable: Always employ defined-risk strategies (e.g., iron condors) and strictly adhere to position sizing rules (e.g., 1-3% capital at risk per trade) to protect against adverse moves.
- Discipline in Entry/Exit is Paramount: Follow precise entry criteria, take profits at 50% of max profit, and implement strict stop-loss rules (e.g., 1x max profit) to manage trades effectively and consistently.